The package comes with four different procedures
addreg			Finds and graphically displays the estimates
addreg.est		Shows estimates found by "addreg"
addreg.find		Computes the estimates and return them in matrix form
addreg.show		Displays graphically the estimates made by addreg.find
addreg.test		Finds the test values.
For descriptions of the required attributes, side effects etc. see Help pages.
As an example we will use data from page 255 of Kalbfleisch and Prentice.
Z1 = sex ( 1= male, 2 = female)
Z2 = treatment group (1 = standard, 2 = test)
Z3 = grade (1= well differentiated, 2 = moderately differentiated, 3 = poorly differentiated)
Z4 = age ( in years)
Z5 = condition (1=no disability, 2=restricted work, 3=requires assistance with self care 4=confined to bed)
Z6 = T-stage (an index of size and infiltration of tumour ranging from 1 to 4, with 1 indicating a small tumour and 4 a massive invasive tumour)
Z7 = N-stage (an index of lymph node metastasis ranging from 0 to 3, with 0 indicating no evidence of metastases and 3 indicating multiple positive nodes or fixed positive nodes)'.
1. How to get the data in the right format:
First we want the data in the following form
|
Variable name |
Data of variable |
| covar |
Matrix of covariate values.
Each observation is one row. |
| times | Times of death / censoring. |
| censor | Indicates death ( 1= death, 0 = censored). |
Table 4.1 Format of input variables
First we have the data on a text file called "c:\data\data.txt", whos column one to seven are the covariates, column eight times of death / sensoring and column nine the indicator of censoring. We read this file into S-plus with:
> data <- matrix(scan("c:\\data\\data.txt"),byrow=T,ncol=9)
Where "ncol=9" means that the data have 9 variables for each (7 covariates, one time variable and one censoring variable) observation. Now the data is a s-plus matrix of the same size and format as the textfile matrix, and we can get the variables with:
> covar <- data[1:7,]
> times <- data[8,]
> censor <- data[9,]
The data are now in the right format.
2. How to find the estimates and get a graphical view of them
This could be done with "addreg", but to reduce the time of compilation we store the estimates on the harddisk for further use. In this way we can se many different graphical views with just one calculation of the estimates.
We call the estimates "estres", and use the function "addreg.find" to find them:
> estres <- addreg.find(covar,times,cencor)
Remark: Stopped at time 1455 because of too low rank
"estres" are a tree dimensional array with estimates, and if we open a graphical devise (In windows use "ALT-G" or "Tools -> Graphics Device -> Open -> Graphics ", and in UNIX use "mofif()" if you jusing x-windows), we can get a view of the estimates for the "condition" variable (which is variable number five) with:
> addreg.show(estres,5,"Condition")
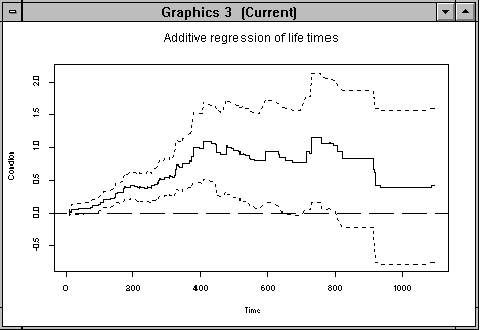
Figure 4.1: Cumulative regression function for covariate "condition"
Or get a view of covariate 1 to 6, with:
> addreg.show(estres,c(1,2,3,4,5,6),label,"Survival of carcinome of the oropharynx",0,1200)
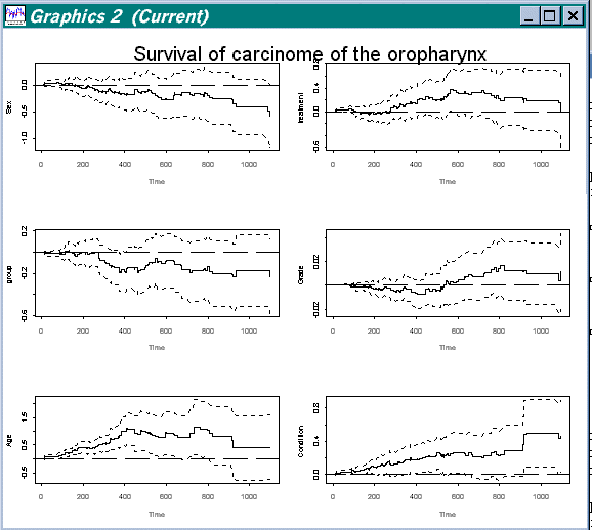
Figure 4.2 Splus view of regression functions for covariates 1 to 6 in data "Survival of oropharynx"
Here variable number two is the column with the variables we want to view. Label is a column of labels for the variables. Then comes the title ("Survival of carcinome of the oropharynx") and where we want the estimation to start and finish. Except the estimates all other variables are optional, and we could just type:
> addreg.show(estres)
We then get a view of all variables (including the constant) over the full period of estimation, as show in the figure below:
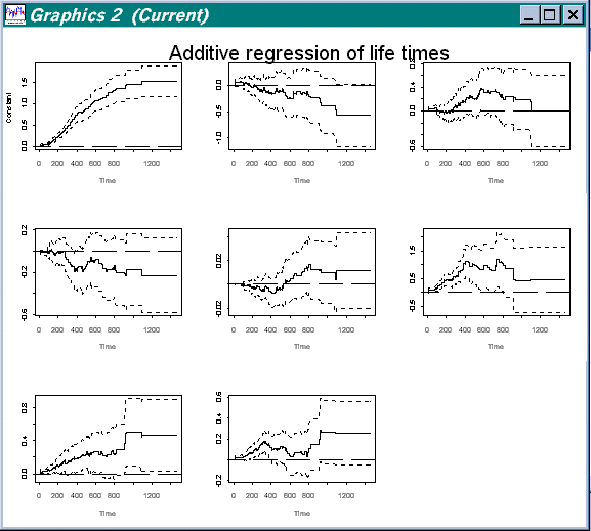
Figure 4.3 All variables in data "Survival of oropharynx"
3. How to use the test routine
It looks like covariate number five (condition) has a significant effect, and we can run a test on the variables with:
> addreg.test(orocovar,orotid,orostatus)
Remark: Resultes are taken at time 1446.284
Test-value: 10.1066 -1.6037 0.9337 -1.3913 0.271 4.113 2.5153 1.9861
P-value: 0 0.1088 0.3505 0.1641 0.7864 0 0.0119 0.047
[1] 0
This show that the covariate no. 5 is significant with any reasonable p-value etc.